Why you need Observability-as-Code
Published: June 2, 2023

By Nicky Carlisle
As IT professionals, one of the key considerations in our field is how to effectively monitor and troubleshoot applications. One approach that has become increasingly popular in recent years is “observability as code” which involves standardizing monitoring rules and incorporating them into both the CI/CD pipeline and the application code. In this post, we will discuss the benefits of observability as code using Splunk Observability Cloud and explore how Terraform can be leveraged to achieve it.
Why Observability as Code?
Observability as code allows organizations to standardize monitoring rules for all applications, making it easier to quickly identify potential issues and take action to address them. For example, when a new microservice is deployed, it can be automatically monitored for CPU usage, and alerts can be set up accordingly by introducing observability as code to the CI/CD pipeline. This process ensures that all applications are monitored consistently and that important metrics are captured. Additionally, by having to work closely to deploy useful and actionable observability solutions, the relationship between the development and operations teams will strengthen, resulting in a more unified application lifecycle.
Why Splunk Observability Cloud?
Splunk Observability Cloud is a cloud-based monitoring and observability platform that allows organizations to collect, analyze, and troubleshoot data from various sources. Here are some examples of why an organization may choose to use it:
- OpenTelemetry: The use of OpenTelemetry to capture logs, metrics, and traces means that you are not locked into one vendor. If you already have OpenTelemetry libraries installed in your applications, then starting to collect data will take minutes or hours rather than months.
- Scalability: Splunk Observability Cloud is a fully-managed service that can easily scale to handle large amounts of data and numerous users. This allows organizations to easily adapt to changing business needs and fluctuations in data volume.
- Automation: Splunk Observability Cloud features automation for many common monitoring and troubleshooting tasks, such as data collection, indexing, and alerting. This can save organizations time and resources allowing them to focus on visualizing and reporting on data in meaningful ways. Additionally, automation is a key ingredient to a “zero trust” architecture.
- Smart insights and visualization: The platform provides several prebuilt dashboards, advanced analytics, and machine learning-based insights for efficient identification and troubleshooting of performance issues.
- Security: Splunk Observability Cloud is compliant with several security standards and regulations and provides robust security features such as RBAC and data encryption.
- Observability everywhere: Whether you’re already in the cloud, on prem, or hybrid Splunk Observability Cloud can get you the visibility you need.
How do Observability as Code and Splunk o11y Cloud work together?
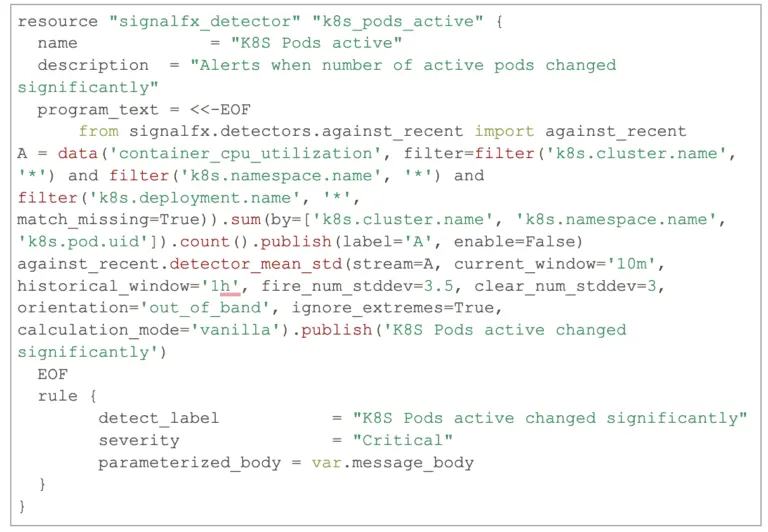
One way of using observability as code and Splunk together is via Terraform. The provider for this functionality in Terraform is SignalFX (a company acquired by Splunk and rebranded to o11y Cloud). Using the SignalFX provider allows you to create detectors, dashboards, and more in Splunk o11y Cloud. The following is an example of how you might set up a detector to determine if the number of active pods in your Kubernetes cluster changed significantly.
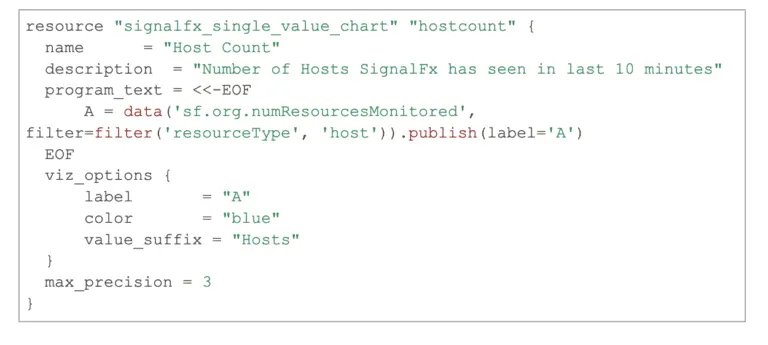
Or if you’d like to create a single value chart for a dashboard which counts the number of hosts detected within the last 10 minutes your Terraform code might look something like this:
Observability as code and Splunk Observability Cloud can help your organization to standardize and automate monitoring rules, improve collaboration between development and operations teams, and increase the effectiveness of your monitoring and troubleshooting efforts. In a world where technical architectures are becoming more and more complex, Splunk 011y and observability as code are a step towards making the resolution and more importantly the prevention of incidents much less daunting.