Leveraging Splunk’s Toolkit to Begin Mastering Observability
Published: June 2, 2023
Splunk’s recent acquisition of SignalFX introduced Splunk Observability Cloud as a powerful new tool in its arsenal of data analytics capabilities. Observability Cloud provides real-time metrics, trace, and log reporting from a variety of infrastructure platforms and services. While evaluating the product, I found that adding monitoring to new data sources with OpenTelemetry was straightforward and generally well-documented, however, I was looking for an option to quickly synthesize various types of custom data in order to create dashboards without having to deploy real services.
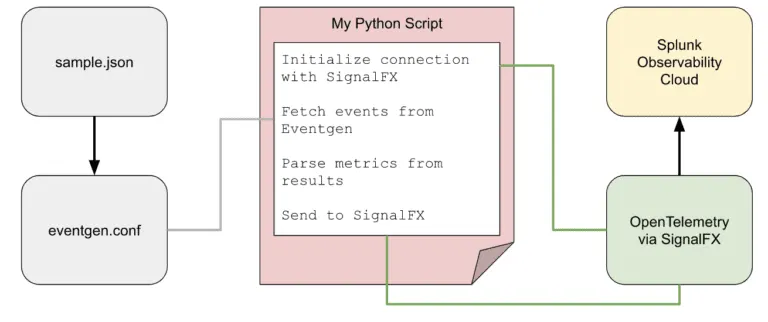
Had I been faced with the same problem in Splunk Enterprise, I would simply install the Eventgen app and quickly synthesize any data I needed. This, of course, isn’t an option in Observability. My first idea was to import the data into Splunk Enterprise and then use Log Observer to send the data into Observability Cloud. I quickly discovered that dashboarding Log Observer data is quite limited using Observability Cloud because it does not currently offer the option to metricize data which Splunk Observability has not indexed. I eventually decided to try using OpenTelemetry to send Eventgen data directly to Observability Cloud and after brushing the cobwebs off my Python skills, I succeeded. Here is how it works…
First off, I needed to install the CLI for Eventgen. This had the prerequisites of git and python3. Here are the installation instructions from the Splunk Eventgen repository:
$ pip install git+https://www.github.com/splunk/eventgen.git
Verify the installation using:
$ splunk_eventgen --version
Once the installation was complete, I was ready to send data to Splunk, but unlike Splunk Enterprise which will accept any logs in any format, Observability Cloud data is ingested through OpenTelemetry so I needed to do some research on that subject.
OpenTelemetry is like a postal service for software. Just as a postal worker picks up letters and packages from all over and delivers them to their intended recipients, OpenTelemetry collects data from all the different parts of a program and sends it off to where it needs to go.
It does this by using probes, which are like data-collecting agents that are placed throughout your software. These probes keep track of things like how many requests your program is handling, how long it takes to process each request, and so on. When they have collected enough data, they package it up and send it off to a collector which acts like the post office hub.
The collector then sorts and routes the data to where it needs to go, whether that be to Splunk, a log file, or to another cloud service where it can be analyzed and used to improve the performance of a program. OpenTelemetry provides a standard format for correlating the data which makes it fast and easy for Splunk to parse and ingest. This was important to consider when thinking about the Eventgen data that was going to be generated.
I began with metrics data, which OpenTelemetry parses using a combination of metric name, value, dimensions, and a timestamp. My data included latency times, for example, broken down by service names. The OpenTelemetry documentation includes recommended naming conventions for specific types of data…in my case, http.client.duration looked to be the best fit for my needs. The dimensions included all the fields by which that metric would be broken down in my dashboards. This included fields such as service, http method, and a few others.
Traces have a slightly different format than metrics. They require a trace ID and span ID to correlate the logs. These traces include attributes by which the data will be searched. This was less relevant in my case but I wanted my solution to allow for the possibility of future usage of traces. Armed with this understanding, I began to devise a solution.
Since OpenTelemetry uses JSON as its data format, I decided to use the same format for my Eventgen samples. My sample data needed a timestamp, metric, and some dimensions:
{
   "timestamp":"##TIMESTAMP##",
   "dimensions":{
      "app_id":"##APP_ID##",
      "host":"##HOST##"
   },
   "metrics":{
      "latency":"##LATENCY##"
   }
}
In order to make parsing the file easier, I removed all extraneous spaces and line breaks from the json file after creating it.
This would provide me with some basic metrics broken down by a handful of dimensions. The Eventgen configuration was fairly straightforward:
[metrics_data.json]
index=index_name
interval = 60
earliest = -5m
latest = now
disabled = 0
source = source_name
sourcetype = sourcetype_name
count=50
# Generate a timestamp
token.0.token = ##TIMESTAMP##
token.0.replacementType = timestamp
token.0.replacement = %Y-%m-%dT%H:%M:%S
# App ID is a random 24-digit hex value
token.1.token = ##APP_ID##
token.1.replacementType = random
token.1.replacement = hex(24)
# Host is a random value from a list
token.2.token = ##HOST##
token.2.replacementType = random
token.2.replacement = list["host1","host2",”host3”]
# Latency is a random number between 20 and 1000
token.3.token = ##LATENCY##
token.3.replacementType = random
token.3.replacement = integer[20:1000]
In order to send the data using OpenTelemetry, I needed to include the SignalFX library in Python.
pip install signalfx
In my Python script, I would need to capture arguments for region, token value, eventgen configuration file path, event type, and output type (metric or trace) then initialize the signalfx object including the definition of the Splunk endpoints.
client = signalfx.SignalFx(
api_endpoint = 'https://api.'+arg_region+'.signalfx.com',
ingest_endpoint = 'https://ingest.'+arg_region+'.signalfx.com',
stream_endpoint = 'https://stream.'+arg_region+'.signalfx.com'
)
ingest = client.ingest(arg_token)
Next, I would need to generate the Eventgen data. There were several options for doing this, but I had the most success with simply calling the CLI directly and capturing the results like this:
  proc = subprocess.Popen(
          [
              'python3'
              ,'-m'
              ,'splunk_eventgen'
              ,'-v'
              ,'generate'
              ,arg_file
          ],
          stdout=subprocess.PIPE,
          universal_newlines=True
  )
  try:
    message, err = proc.communicate(timeout=10)
  except:
    proc.kill()
    message, error = proc.communicate()

  dom = xml.dom.minidom.parseString('<events>'+message+'</events>')
  data_to_send = dom.getElementsByTagName('data')
I had used a similar method to send data to other sources such as an Azure Event Hub in the past and it worked well.
Next, I would need to parse this JSON file using python before sending the data to Splunk. I needed to send the metric along with its dimensions for each metric in the sample data along with the date in epoch microseconds. I could parse that using python in the following way:
for node in data_to_send:
json_data = json.loads(html.unescape(str(node.firstChild.toxml())))
if (json_data["timestamp"] > ""):
dt = datetime.datetime(*time.strptime(json_data["timestamp"], "%Y-%m-%dT%H:%M:%S")[0:6])
fullDateTime = dt.microsecond
else:
dt = int(datetime.timestamp())
fullDateTime = str(dt) + "000"
for metric in json_data["metrics"]:
if (arg_output == "metric"):
ingest.send(gauges=[
{
'metric': metric
,'value': json_data["metrics"][metric]
,'dimensions': json_data["dimensions"]
,'timestamp': fullDateTime
}
])
else:
ingest.send_event(
category = 'USER_DEFINED'
,event_type = arg_event_type
,dimensions = json_data["dimensions"]
,timestamp = fullDateTime
)
ingest.stop()
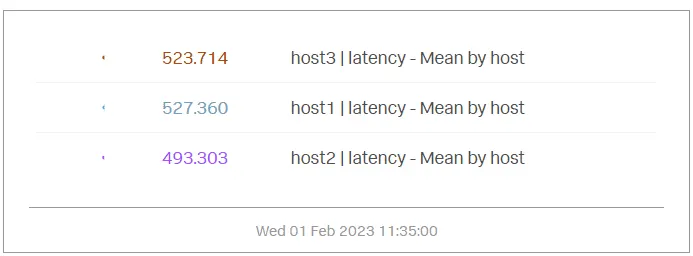
Running this script in the following way sent the data into Splunk Observability successfully:
python3 main.py -r us1 -t TOKEN_VALUE -f ./eventgen/eventgen.conf -o metric -e sample_type
In Splunk, I could now use the Metrics Finder to lookup the data by host or metric name to create a chart.
While it is generally best to ingest real data into Splunk, sometimes testing requires more creative solutions such as this one. OpenTelemetry helps to make accessing your data from a variety of sources straightforward through its compatibility with countless platforms and versatile infrastructures.