Visualizing API Traffic Flows with API Audit Logging
Published: May 24, 2024


Effective Logging – Unlocking API Insights
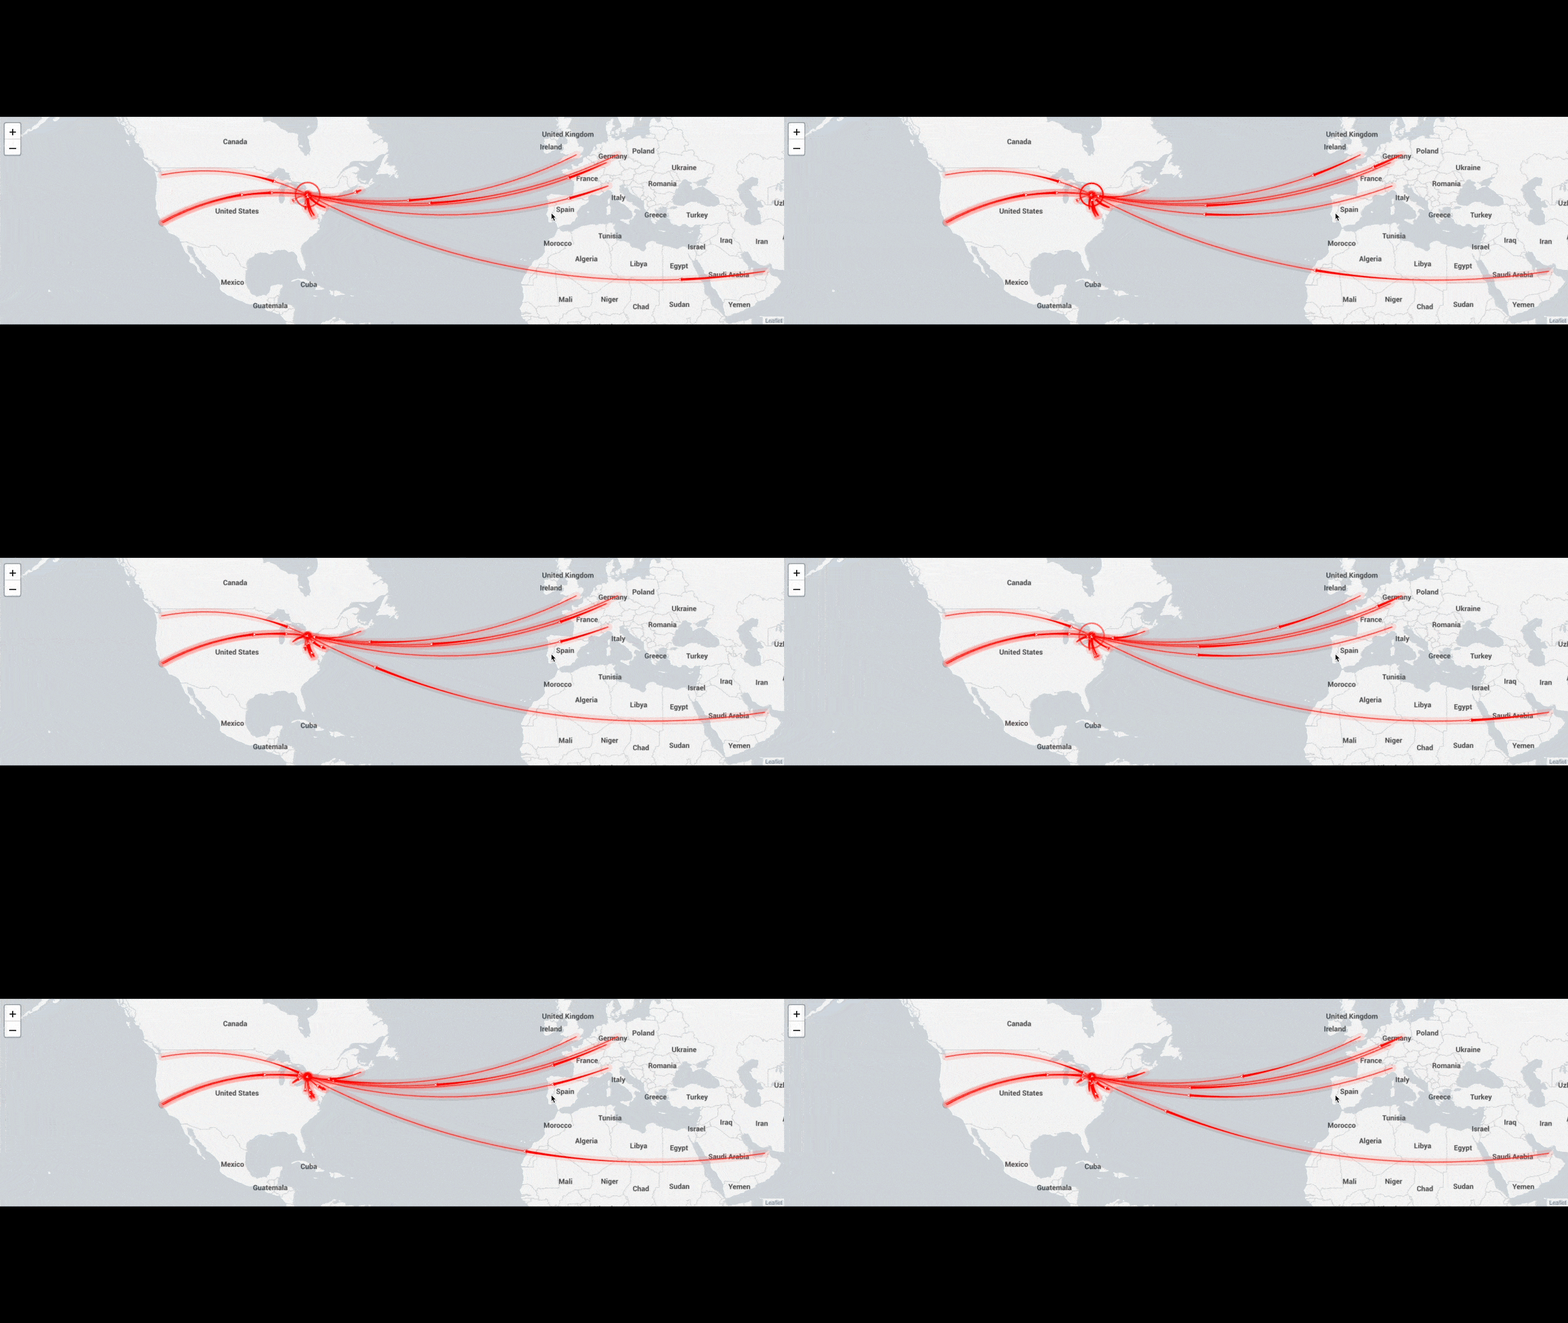
In today’s API-centric digital landscape, having a proper understanding of which API consumers are using which APIs, and where they’re using them from, is paramount for ensuring operational efficiency. Understanding your most frequently utilized and busiest APIs can allow you to leverage decisions about which infrastructure would be the most optimal investment. Incorporating comprehensive API audit logs into your strategy ensures you capture detailed insights about these interactions.
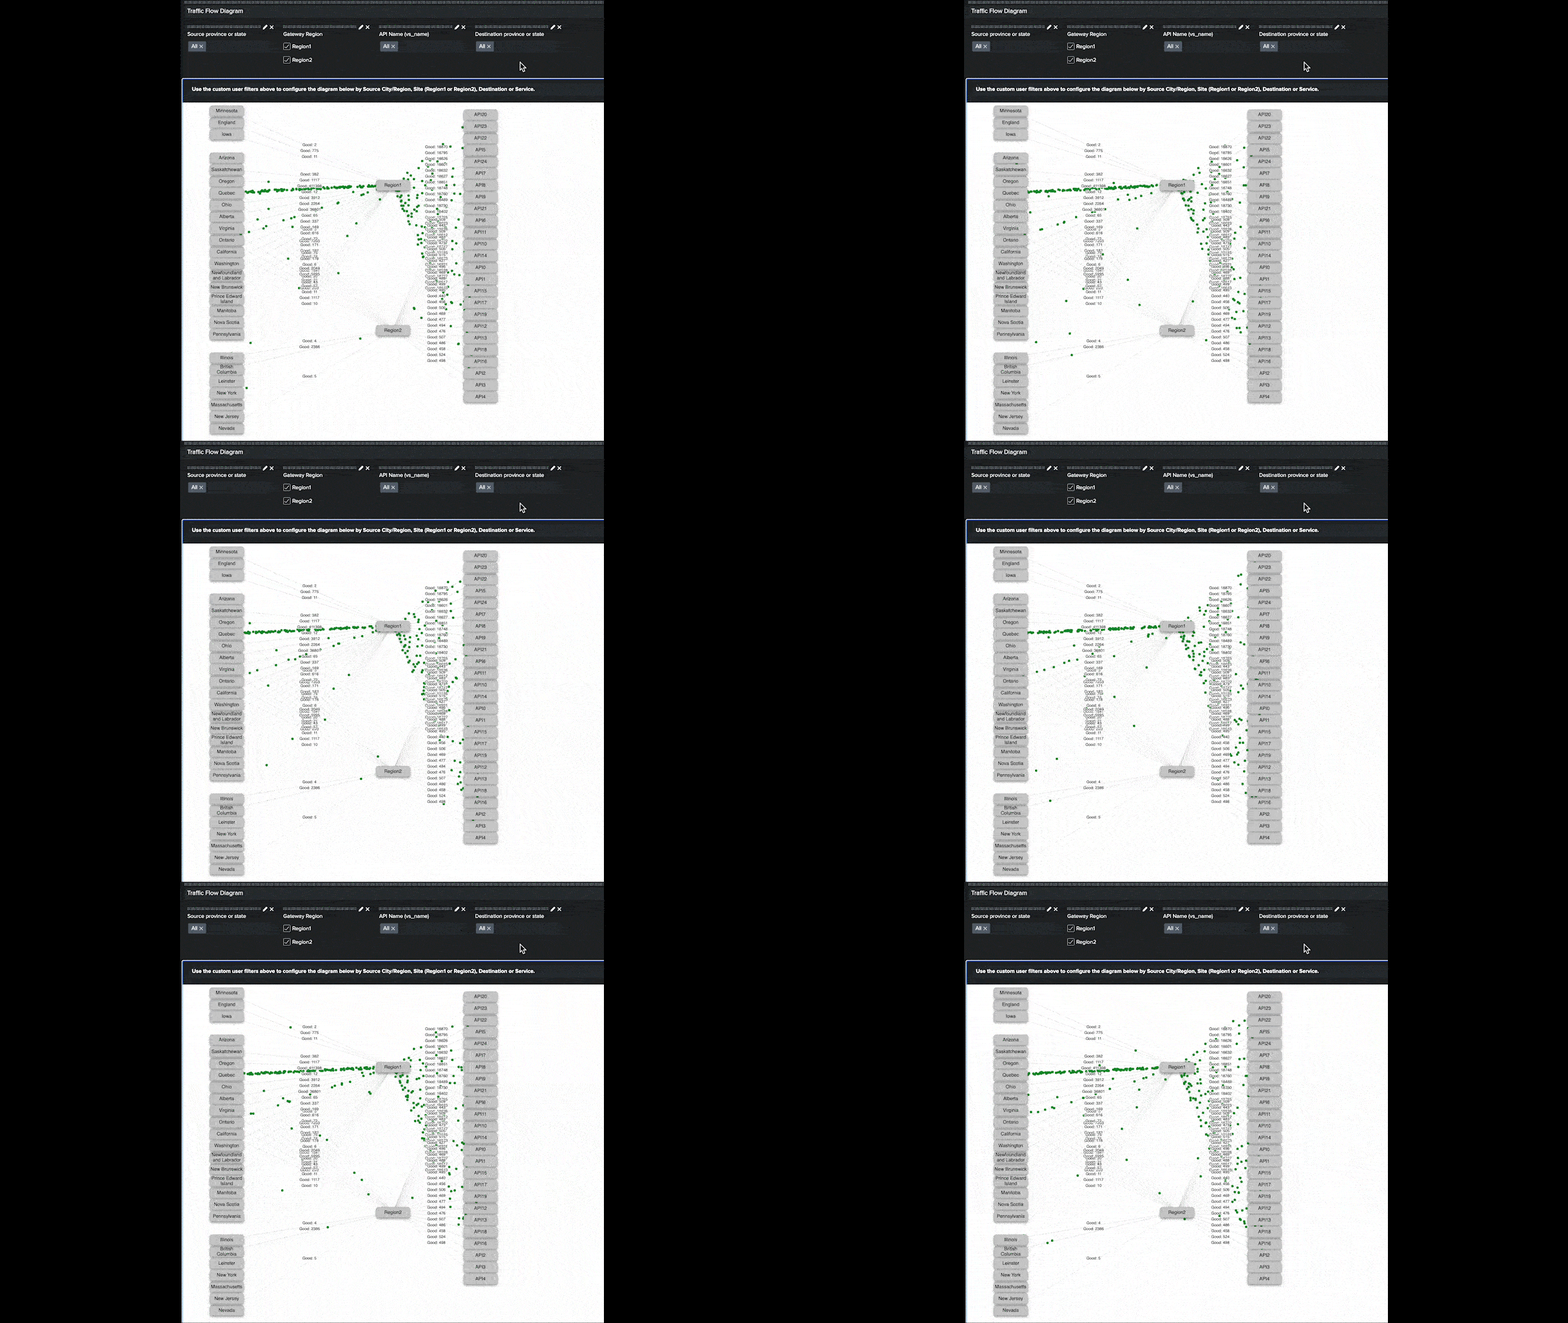
In a complex environment, understanding these optimizations can be difficult, which is where effective API audit logs can enable reporting and visualization on API traffic flows – which in turn would allow for clarity into which APIs require additional infrastructure and support.
Using the information gained from this post will empower you to visualize, analyze, and act upon your API audit logging data like never before.
How to Create Effective API Audit Logs
“Create effective API audit logs” – It’s easier said than done, but how exactly should API audit logs be implemented? First and foremost, in a complex enterprise environment, it is imperative to implement a robust API gateway between your clients and their API destinations. At a very high level an API gateway, as the name suggests, acts as a gatekeeper of sorts to prevent bad actors from accessing potentially sensitive information but their purpose can extend well beyond that function alone. Ensuring that your API gateway or access point is configured to generate comprehensive API audit logs will provide you with the critical data needed for thorough analysis.

We want to ensure that the API audit logs generated by your API gateway can yield actionable information your team can use to properly visualize and optimize your API traffic flow. There are a few key fields that must be included in your API audit logs – client source, API access site, destination and latency. Latency can be further expanded on with gateway latency, backend latency and overall API latency. By clearly defining and monitoring these fields we can implement an API network flow visualization that can tell us which clients are using which API destinations, how long it’s taking and what routing path the request travels on. This in turn will allow us to create alerts and reporting surrounding which APIs require further capital investment. Additionally, ensuring consistent formatting and accuracy in your API audit logs is essential for reliable data analysis
Strategic Advantages of Visualizing API Traffic
There are a number of clear benefits to your business of implementing API audit visualization in your enterprise.
The general benefit of API audit log visualization is to improve the performance of API requests and responsiveness to improve client experiences. You can do this by:
- Deciding whether to open new endpoints in cloud or corporate data centers to reduce the network delays between consumers and the APIs, based on which regions most of your consumers are connecting from.
- Making DNS load balancing optimizations or changes to route customers to their local endpoints more effectively. We have seen our customers identify outdated IP tables in their DNS load balancing platforms, for example, as a result of these API audit logs.
- See which APIs are the busiest to prioritize connections or routing decisions.
While performance is always something to strive to optimize, other benefits of visualizing your API audit log traffic can include:
- Identifying anomalous traffic patterns that might indicate security threats such as DDoS attacks, unauthorized access attempts, or data breaches.
- Fault detection and troubleshooting, visualization can aid in quickly identifying and troubleshooting network issues or service disruptions by visualizing traffic flows and pinpointing areas of congestion or failure.
- Leveraging historical API traffic data visualizations, your enterprise can develop predictive analytics models to forecast future demand, plan resource allocation, and optimize operations proactively.
- Visualizing traffic data can assist in demonstrating compliance with regulatory requirements by providing insights into data handling, privacy measures, and adherence to industry standards.
By leveraging API audit log and implementing visualizations, businesses can not only improve API performance and functionality, but also improve their API security posture, develop new predictive analytics models to track API consumer behaviors and even demonstrate regulatory compliance.
In the next post about visualization, we’ll be talking about how to implement these visualizations in Splunk Enterprise, and how to get them working for you. Utilizing Splunk Enterprise to analyze API audit logs can offer even deeper insights and operational efficiencies.
If you’d like to find out more about how to create API audit logs, or would like to see some of this in action, Solsys has expertise in how to create these logs, what they should contain, and how to use them. We have a demo we’d be happy to show you too, and we can share our experience. Please use the contact us link to reach out to talk to one of our experts!


